Blog Visitor Analytics
Prologue
I’ve been blogging for over 20 years — half my life. With Weibo and WeChat, my posting frequency has dropped, but that’s fine. Blogs are for long, deep dives; microblogging is for quick hits.
Since switching to a static site, the upside is simple HTML files you can put anywhere. The downside: anything requiring server-side functionality is impossible — comments, analytics, etc. Comments can use third-party services; analytics can use third-party tools. But they’re not your own, and they’re not very convenient. Cloudflare has its own analytics, but the data isn’t comprehensive, hard to export, and only retained for a limited time. So I decided to write my own analytics.
Method
I initially used Cloudflare Workers to write a serverless analytics app, storing data in Cloudflare’s SQLite database. But I found Cloudflare Workers is blocked by the GFW — the entire *.workers.dev domain is inaccessible from China. Probably because someone used it for circumvention. So I abandoned Workers and wrote my own solution.
I wrote a simple Python analytics program and open-sourced it on GitHub:
It’s simple: a URL hosted on a free Oracle VM, embedded in the blog template. It logs the visitor’s IP, uses ipinfo.io API to get more info (country, location, coordinates, ISP, etc.), stores it in MariaDB, and uses Grafana for visualization.
This isn’t perfectly scientific. Two main issues:
- False negatives: if the client disables JavaScript, or JS fails, the visit isn’t logged. Common for crawlers.
- False positives: direct access to the logging URL gets recorded, but that’s not real blog traffic.
Close enough. Some data is better than none.
Results
I use Grafana to display data from three perspectives:
Overview

About 6,000 visits per month, 200 per day. Not bad. But a good number are crawlers — more on that later. Some days have high traffic (1,000+), some very low (10-ish). That’s normal — some days I post articles, most days I don’t.
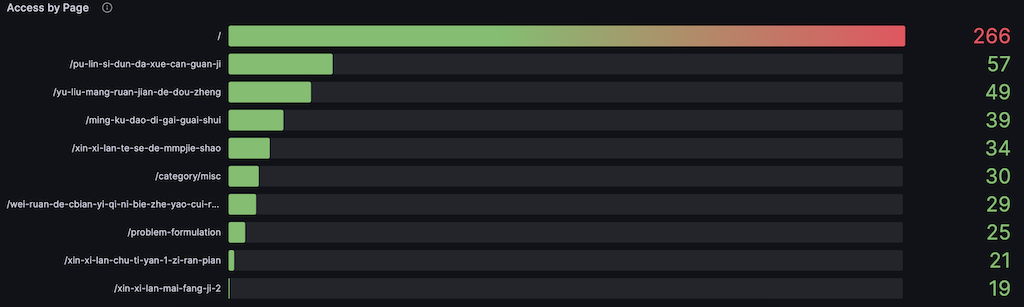
This shows page-level traffic. Most visited is the homepage — expected, since it’s the default landing page. Next are individual articles. The most-visited article is one I wrote about 10 years ago:
I wrote this when I visited Princeton during a US conference. It ranks high on Google for Chinese searches related to Princeton visits. Many people probably find it through Google and use it as a guide. I wish I’d written it better, to avoid misleading anyone.

Geographic Information
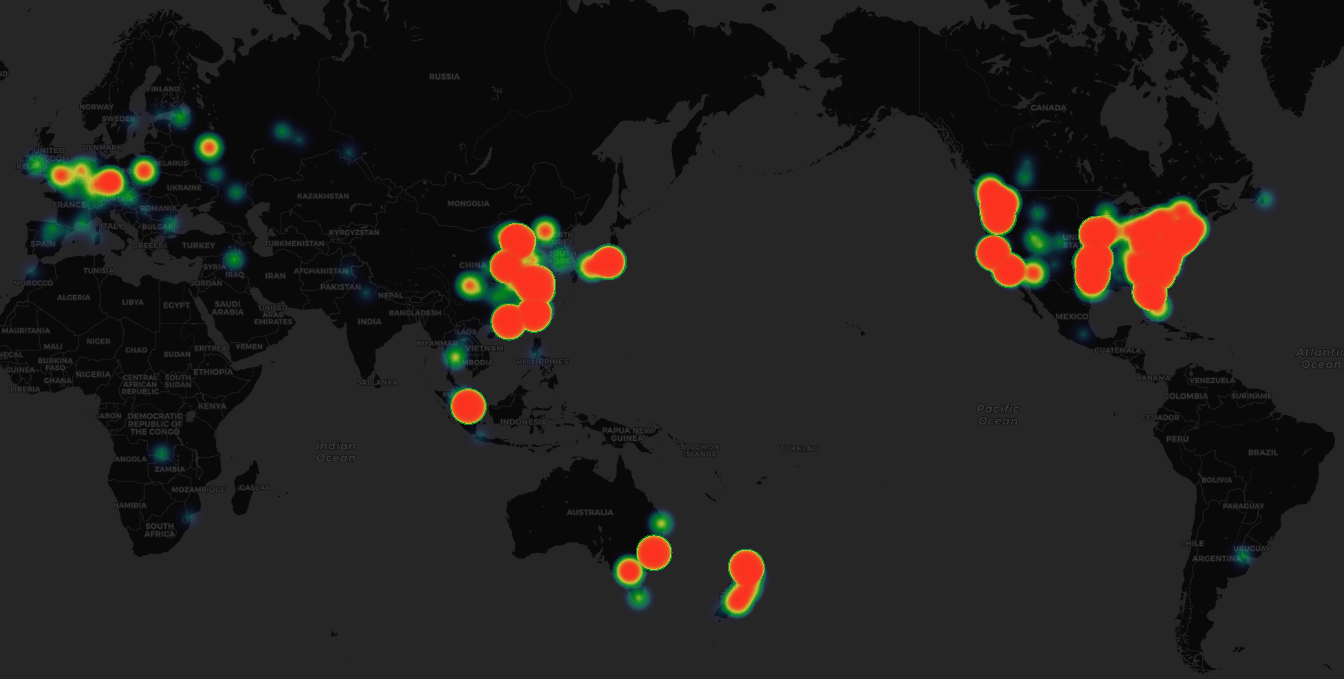
The second view is geographic. Reverse geolocation from IP addresses is very mature. Plotting all visits on a world map in Grafana is easy and quite impressive:
This basically reflects global internet development: North America is lit up (mostly Google data centers), East Asia is good, Europe is decent (some European countries might be VPNs or web proxies, not real user IPs). South America and Africa have no traffic. Oceania’s internet isn’t great, but I write a lot about New Zealand, so there’s some traffic.
For concrete data: unique IPs on the left, total visits on the right. Top 5: USA, China, New Zealand, Australia, Canada.

Whether unique or total, the US leads. China and NZ follow — one higher on total visits, the other on unique IPs. The remaining countries are either places with large Chinese diaspora or geographically close to NZ.
Client Information
Client info is parsed from User-Agent strings. Again, not perfectly accurate — clients can fake User-Agent strings. I knew there were many crawlers but didn’t have specific numbers until I parsed User-Agent data:

The Python library reported 30% as bots, but I think it’s higher — bots can disguise themselves as regular users. For reference, bot sources:
- Google: 1707
- Bing: 11
- Baidu: 7
- Apple: 2
- Yisou: 1
- Yandex: 1
Google is a sieve — it crawls everything. Chinese search engines barely crawl my site — probably because it’s not registered in China (an illegal overseas site). One oddball: a Russian search engine.
Closing
I’ve thought about shutting down the blog many times. Probably nobody reads it, and it costs money to maintain (mostly the domain). But knowing that even casual posts can subtly influence people — like the Princeton article — makes me think keeping it is worthwhile. It also keeps me motivated to write.
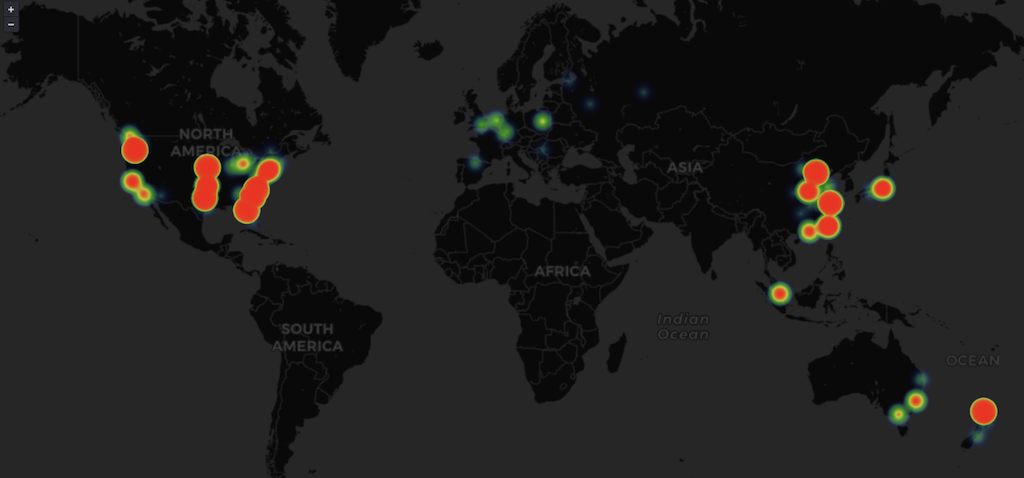
Update: 2024-08-14
About half a year later, every continent finally has data. Looking at this map, it’s quite impressive.